The For You Data Hub
If you are a researcher studying short-video culture, we invite you to discover what you can do with The For You Data Hub. We created this Hub for our own research and we would love to see it used by others. The Hub is an open-source browser-based workbench that turns thousands of short videos into datasets, timelines, maps and findings, all built on data donation. You can use our hosted instance without installing anything or set up your own instance locally or on Google Cloud. Create an account and explore the Hub.
A new account opens on a default dataset, chosen so there is no participant privacy at stake while you look around. Ingesting your own participants' data and running the full pipeline isn't part of that preview. When you're ready for it, email us at info@foryouresearch.net and we'll walk you through it. We'd love to hear from you.
A short tour of the analysis tools
With the default dataset open, here are some things you might try:
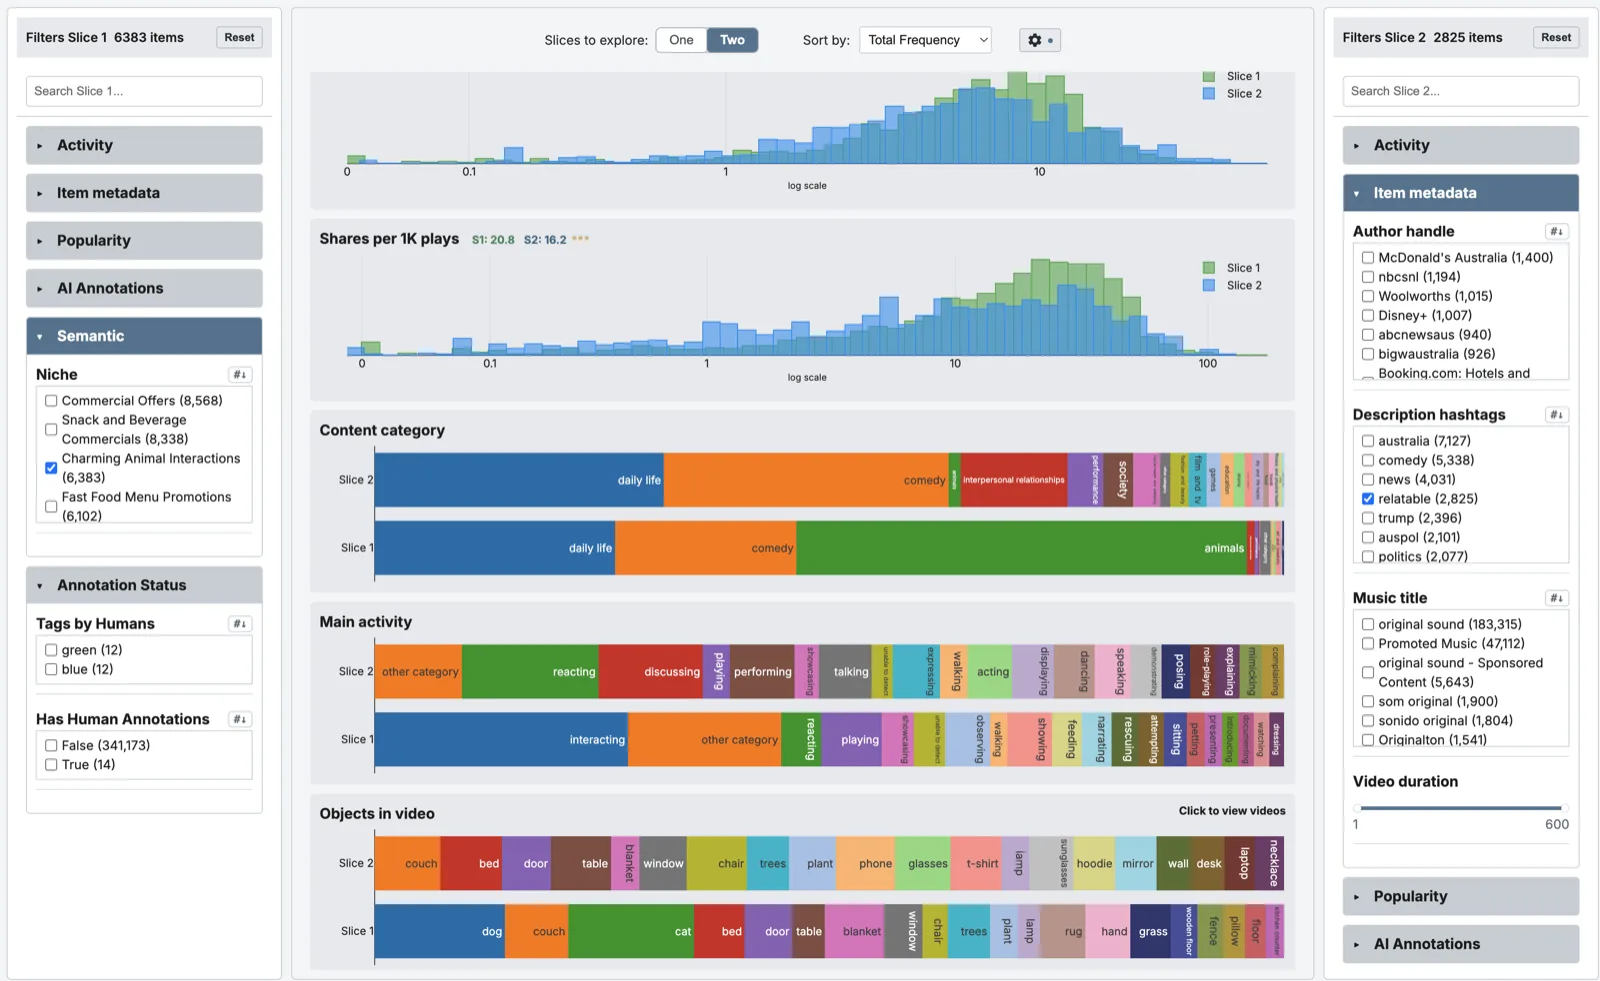
- Get an overview in Explore. Open the Explore tab to see how any variable is distributed across the study. Use the filter panel to slice the data, for example videos from a particular content category, or plays longer than a threshold, and switch to two-slice mode to compare groups side by side. Significance stars flag differences between the slices.
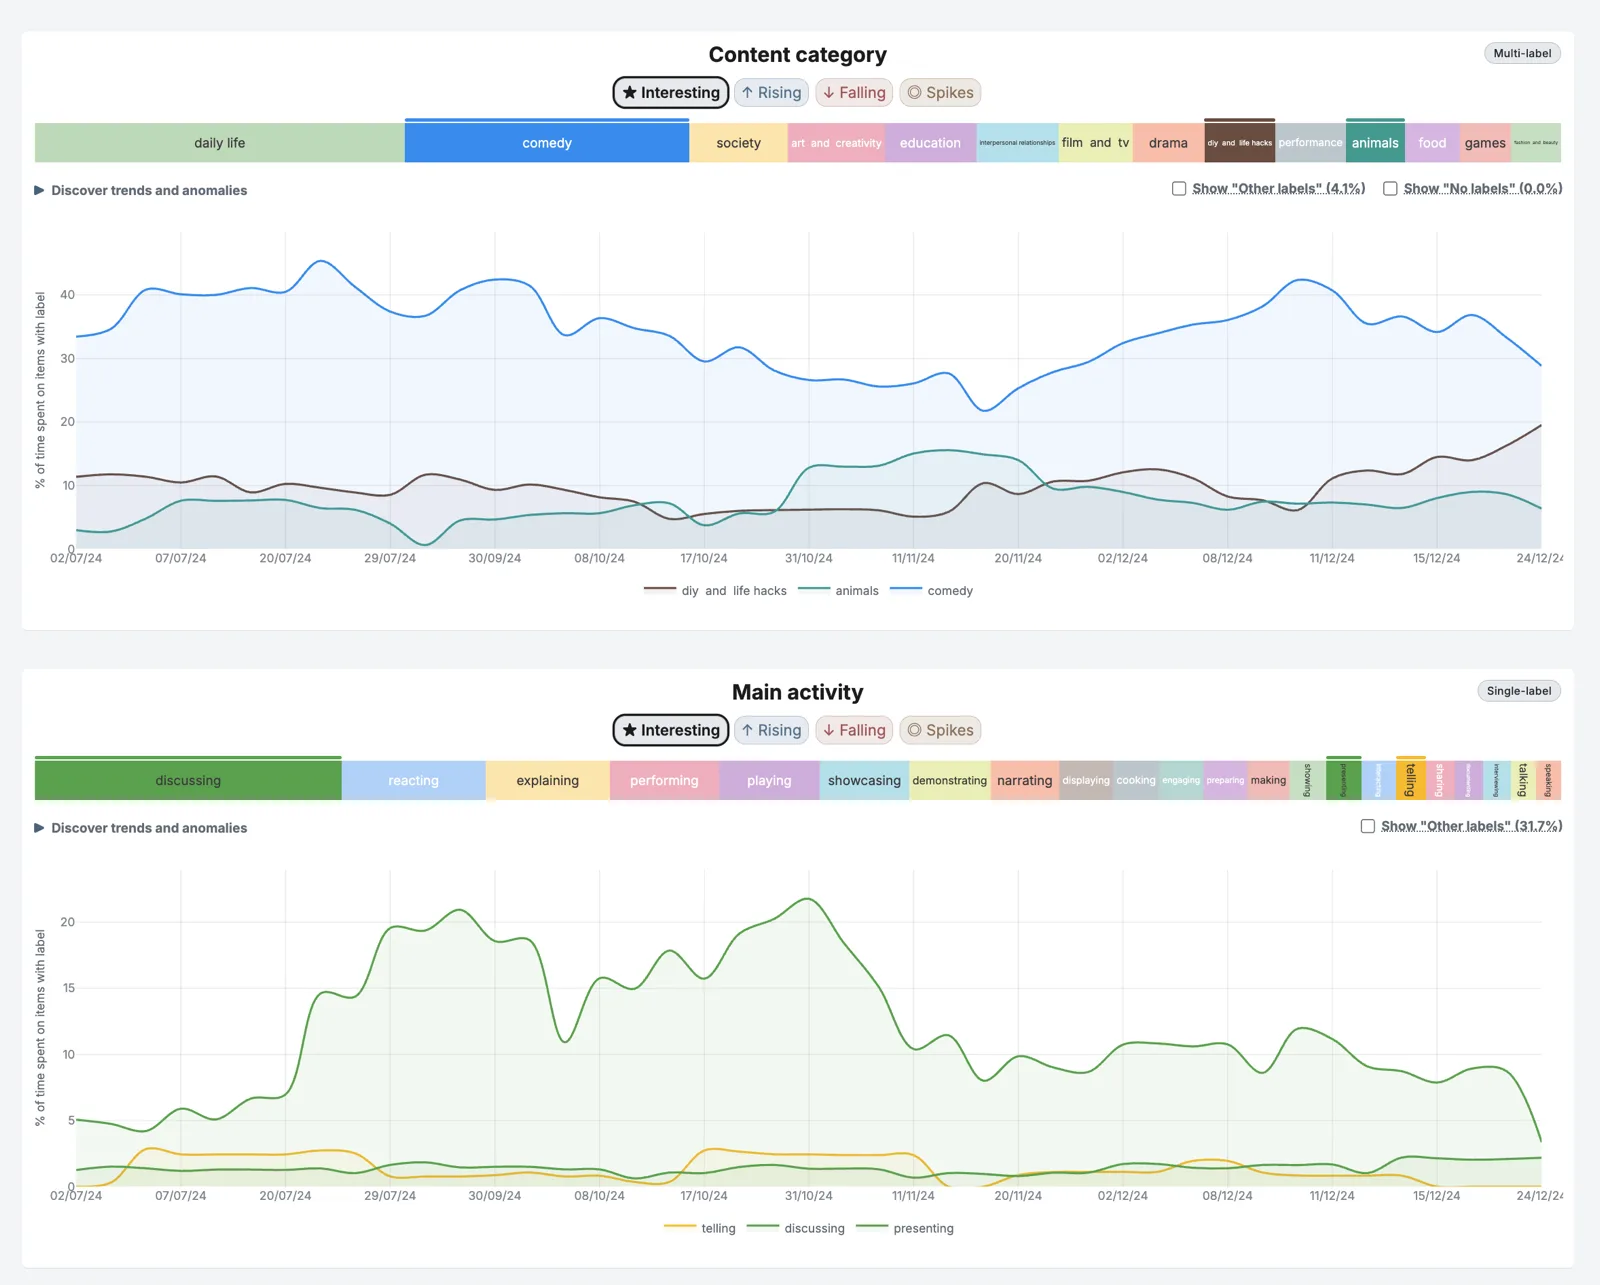
- Follow a participant in Timelines. Pick a collection (one participant's data) and watch how their feed composition evolves day by day. Filter chips isolate rising, falling, spiking or volatile categories, and "Show Findings" lists detected trends, anomalies and structural breaks.
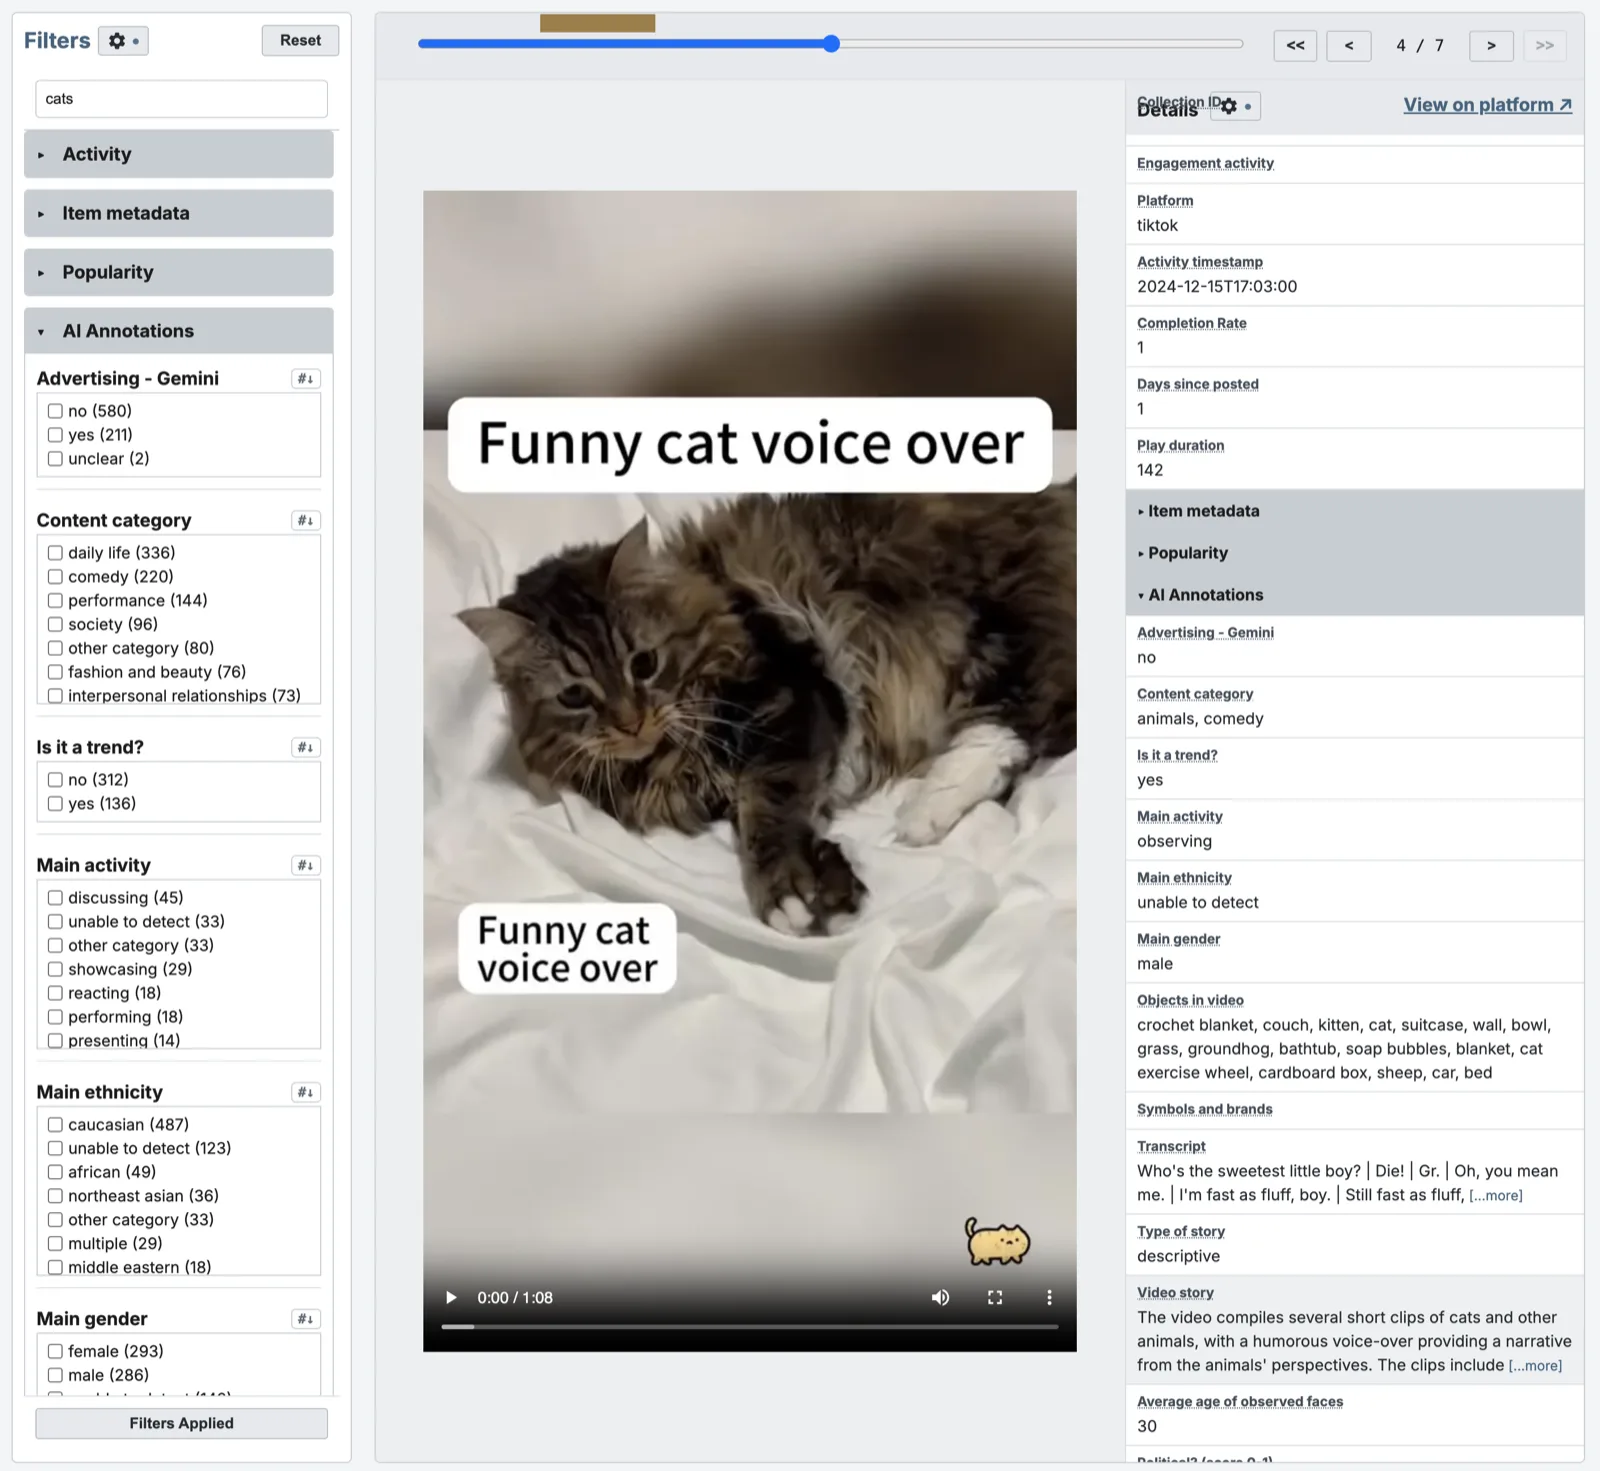
- Drill into videos. From any chart in Explore or Correlations, click through to Video Analysis to watch the underlying videos, inspect their full metadata and AI annotations, and add your own tags and notes.
- Go deeper. Correlations charts relationships between numeric measures (with regression lines, group ellipses and a correlation heatmap). Researchers with full accounts also get Semantic Space, which maps every annotated video by meaning so you can explore the corpus's micro-genres.
Follow the Pipeline
What happens to a donated feed? Follow it through the Hub's five steps, Ingest → Enrich → Annotate → Analyse → Share, from raw data package to research finding. If you're a participant, this is exactly what happens to a donation; if you're a researcher, this is the toolbox you get.
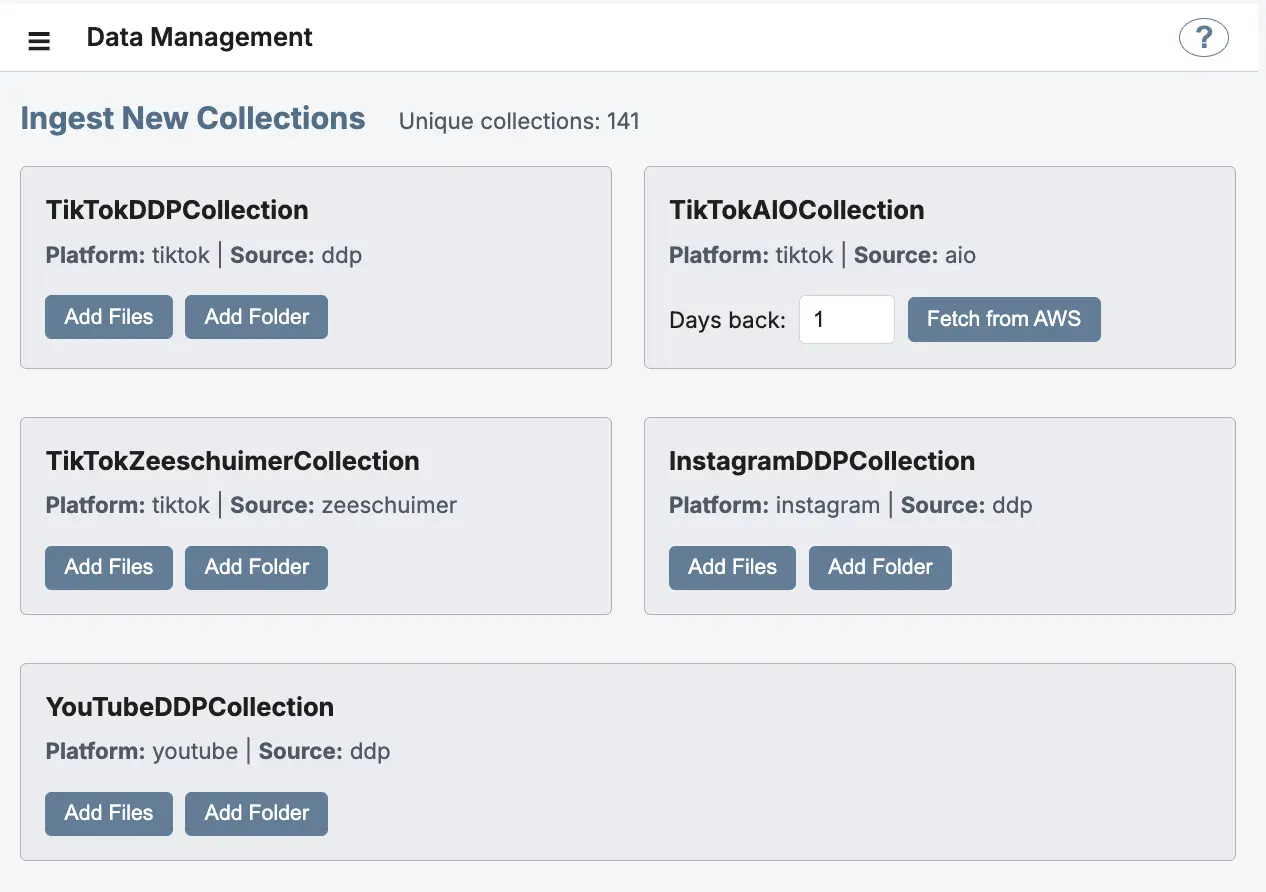
Research participants donate data from TikTok, Instagram Reels and YouTube Shorts. The Data Hub parses the donated data packages into a single clean, queryable corpus, which you curate and structure into studies that cover the time period relevant to your research questions.
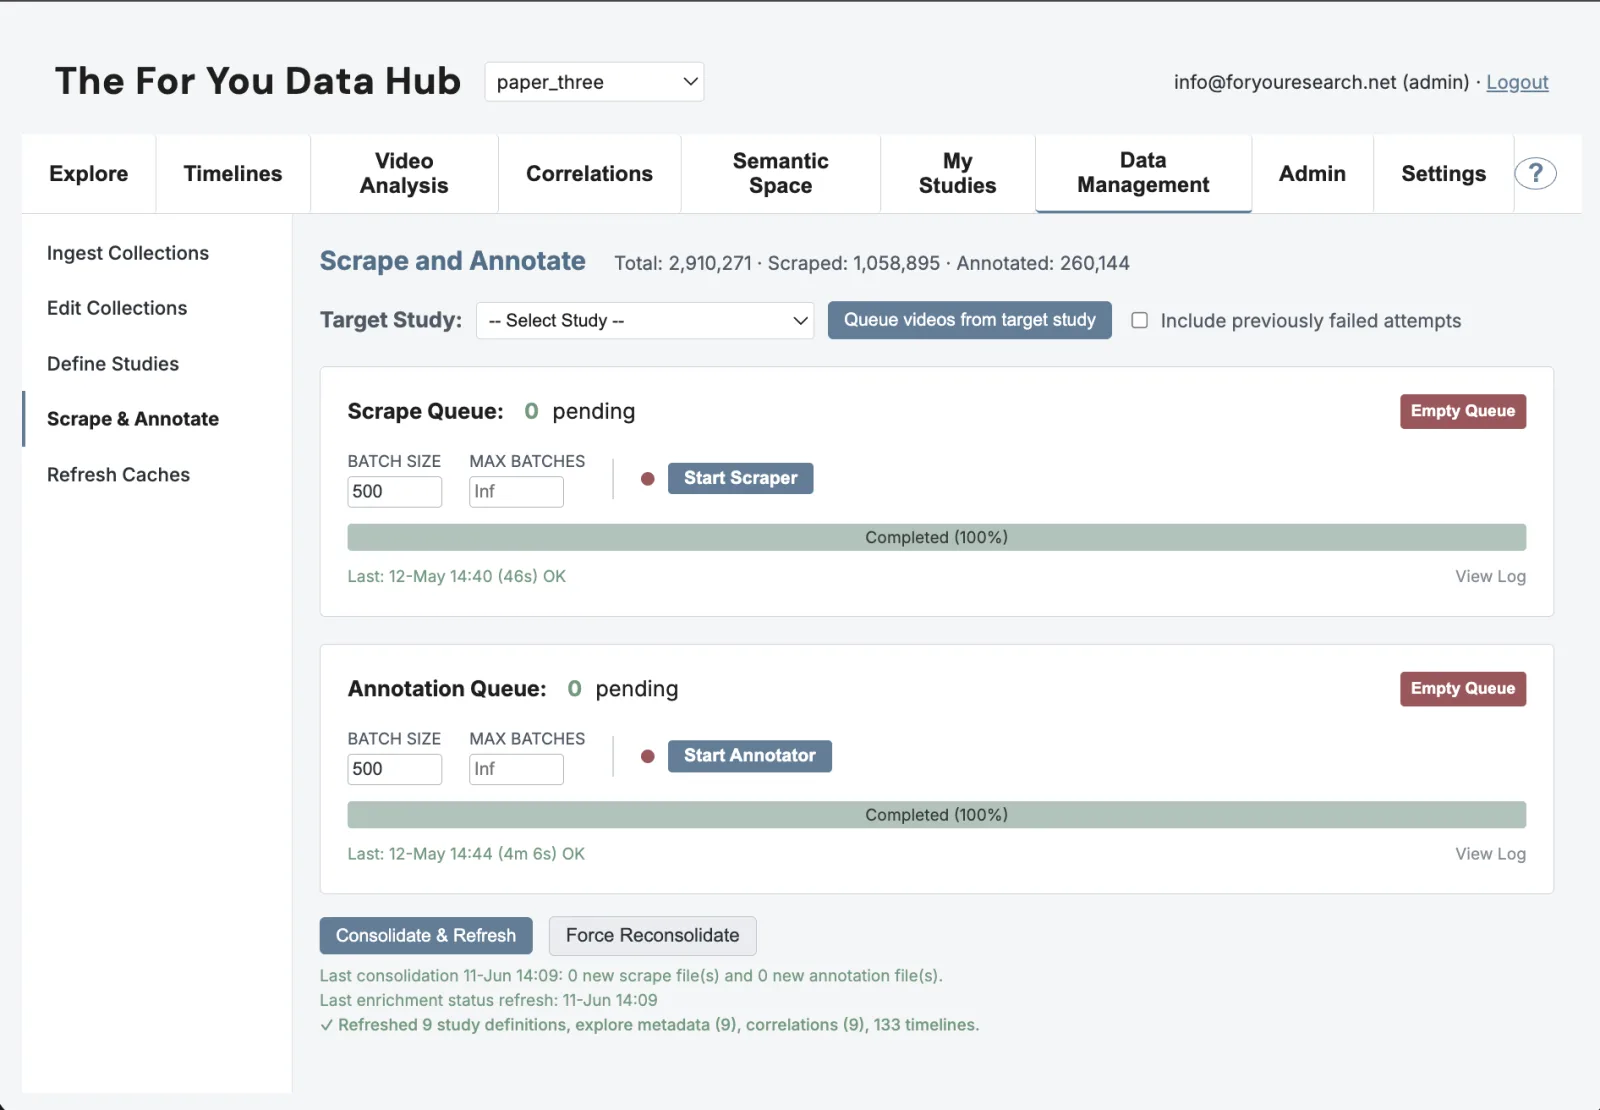
Donated packages arrive stripped of the videos themselves and most metadata. The Hub recovers as much as it can (videos, captions, authors, music and engagement counts) through background scraping queues. Not every item can be recovered, and the Hub keeps track of what is still missing.
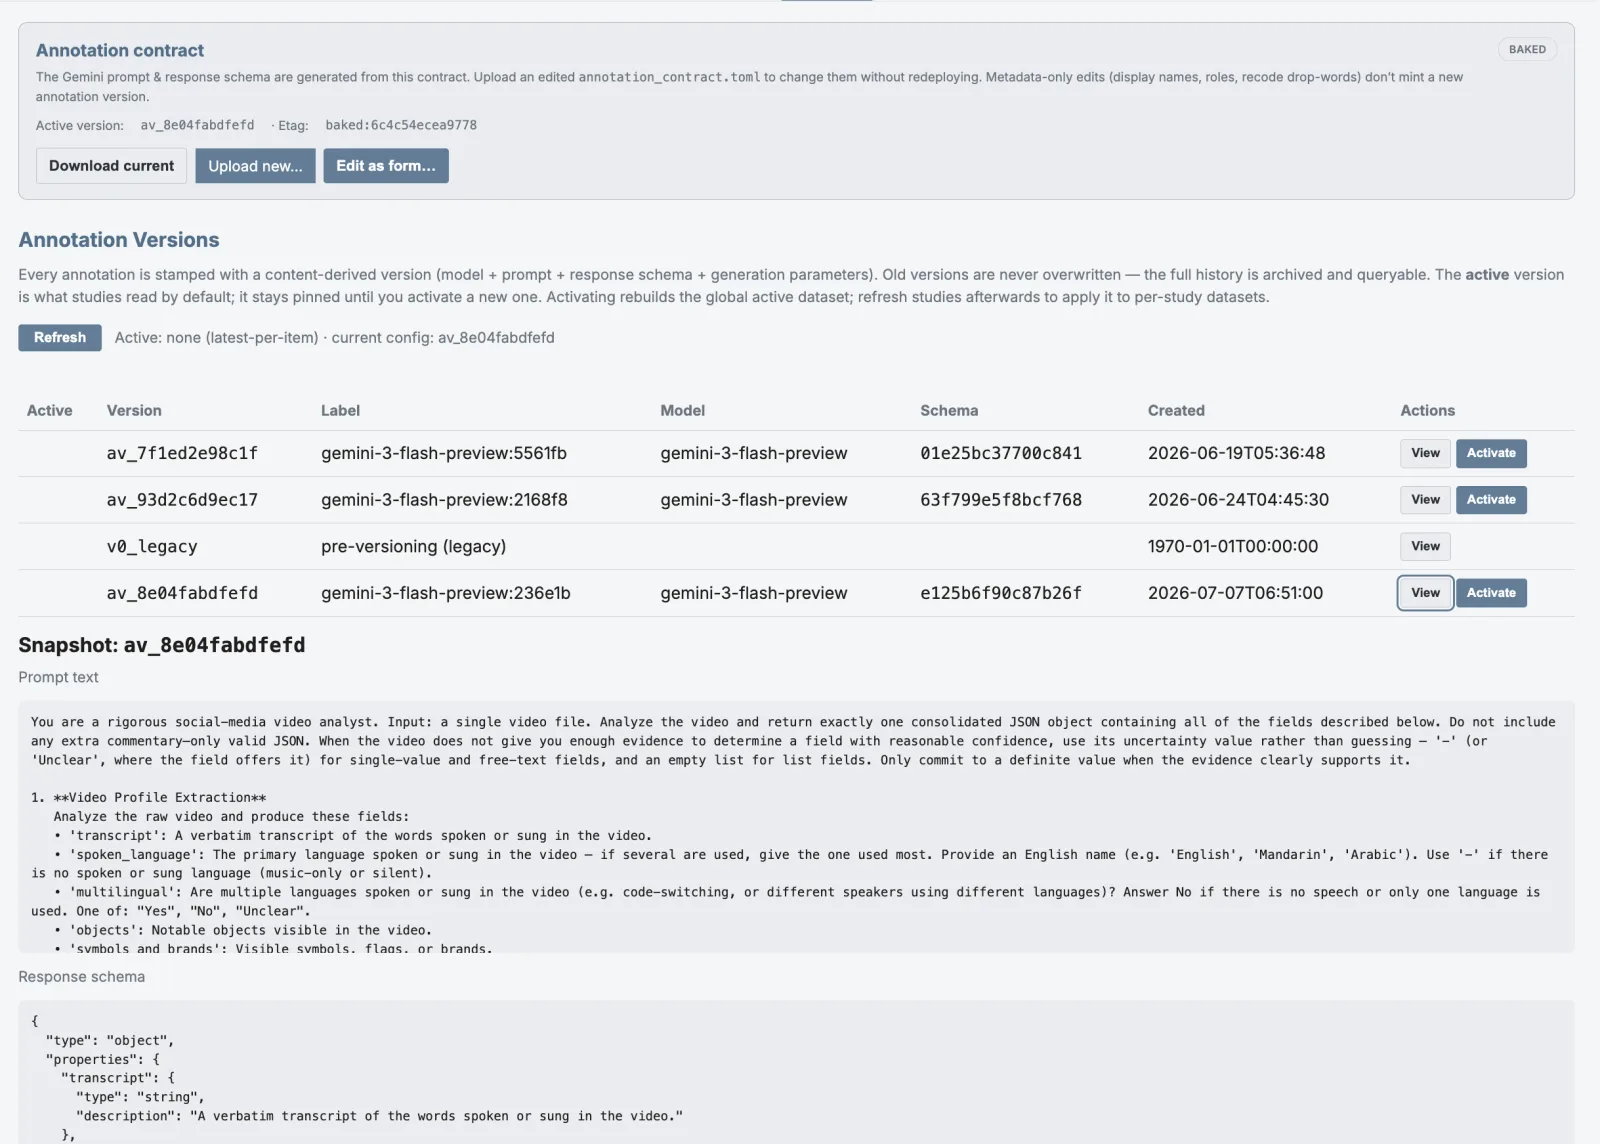
Google Gemini turns each video into structured research variables, such as content category, activities, objects, transcript, sensitivity and more. Machine annotation is useful, but it needs scrutiny, so we wrap it in versioning, testing and human evaluation.
Structured, versioned prompts
Every field the AI fills comes from a declarative annotation contract that generates the Gemini prompt and response schema, editable in the browser. Each run is stamped with a content-derived version (model + prompt + schema + parameters); old versions are never overwritten, so the full annotation history stays archived and queryable, and each study pins the exact version it was built on.
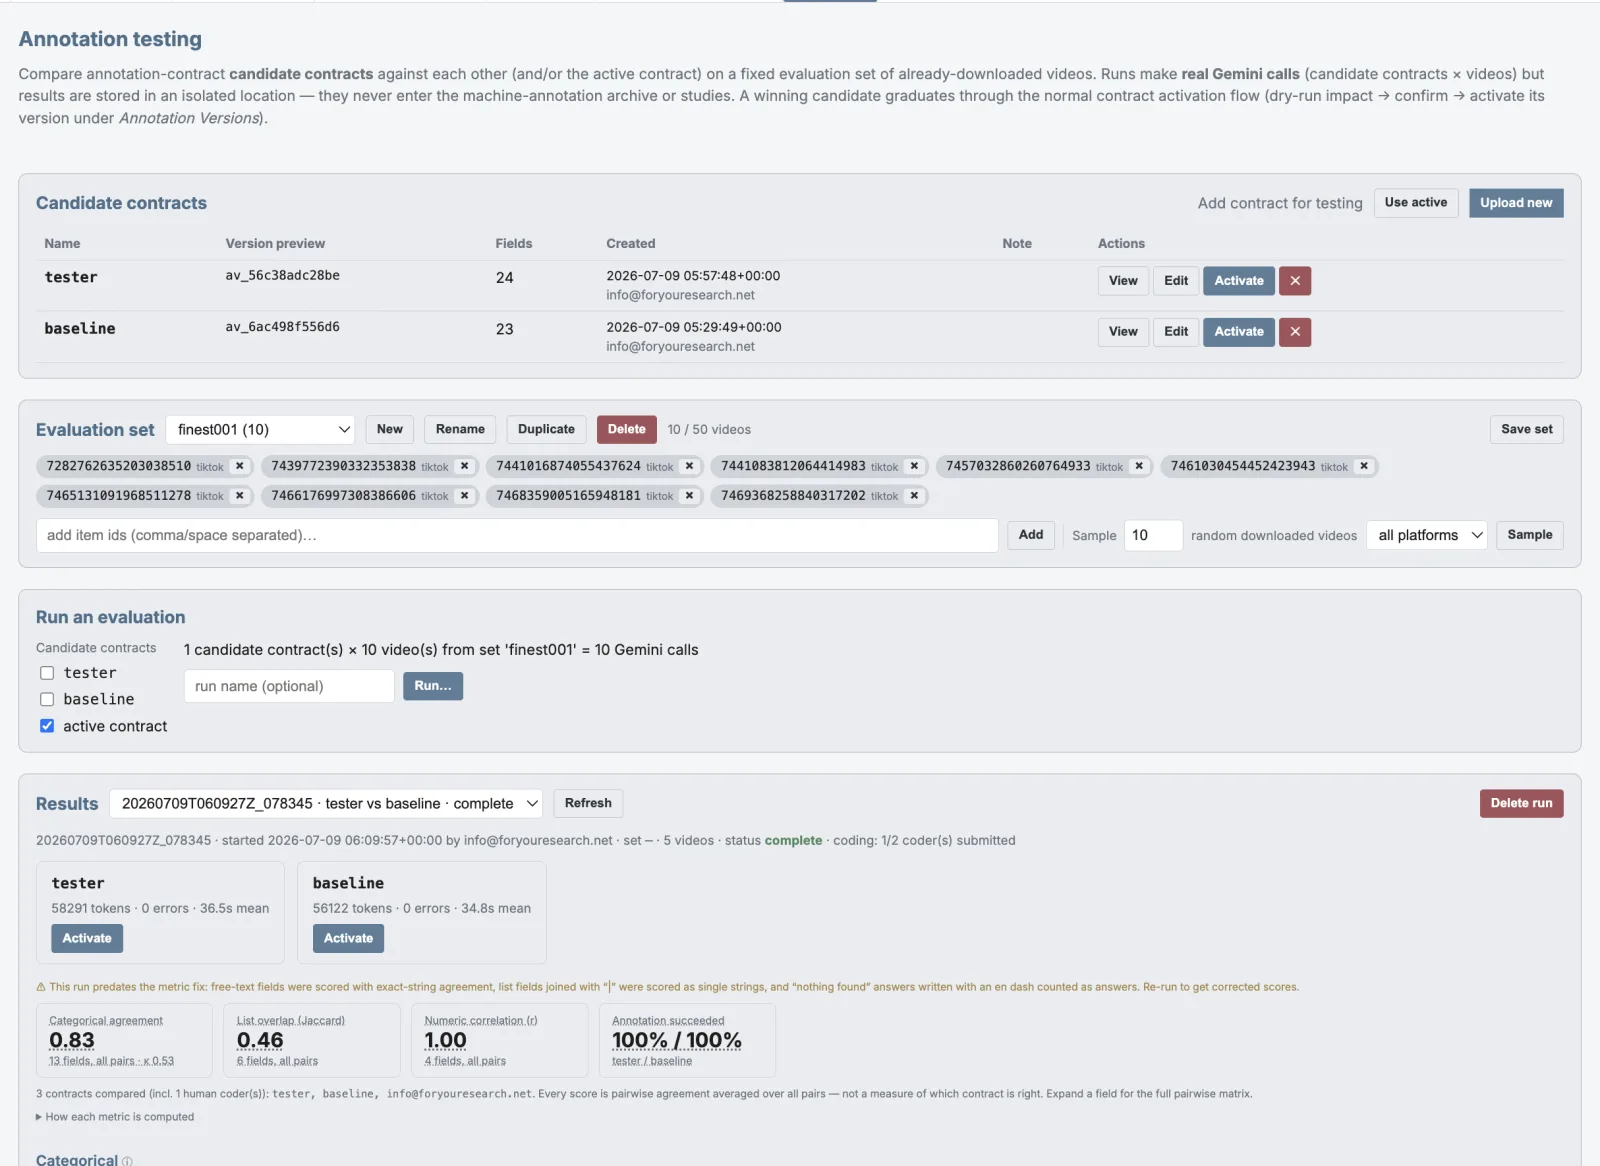
Tested and human-evaluated
Before a prompt goes live, candidate contracts run head-to-head on a fixed evaluation set with real Gemini calls, scored on agreement metrics. Human coders can be invited to blind-code the same videos, so machine annotations are measured against inter-coder reliability. Only a candidate that holds up in this testing graduates into the live dataset.
Different research paradigms in one place: time-series and statistics alongside qualitative video analysis. Every tab works against the study picked in the header, so switching study re-scopes all of them at once.
Compare across the corpus
Explore compares variable distributions across a study, split into two filtered slices with significance testing. Build selections with checkboxes and range sliders, and click any bar to drill into the videos.
Follow a feed over time
Timelines shows how a single participant's feed evolves day by day: smoothed per-variable timelines with trend, anomaly and structural-break detection, and filter chips for rising, falling or spiking categories.
Watch and annotate in context
Video Analysis is the qualitative workbench: watch videos in place, inspect the full enrichment and annotation record, and add your own notes close to the source, alone or with your team.
Zoom in on a single sitting
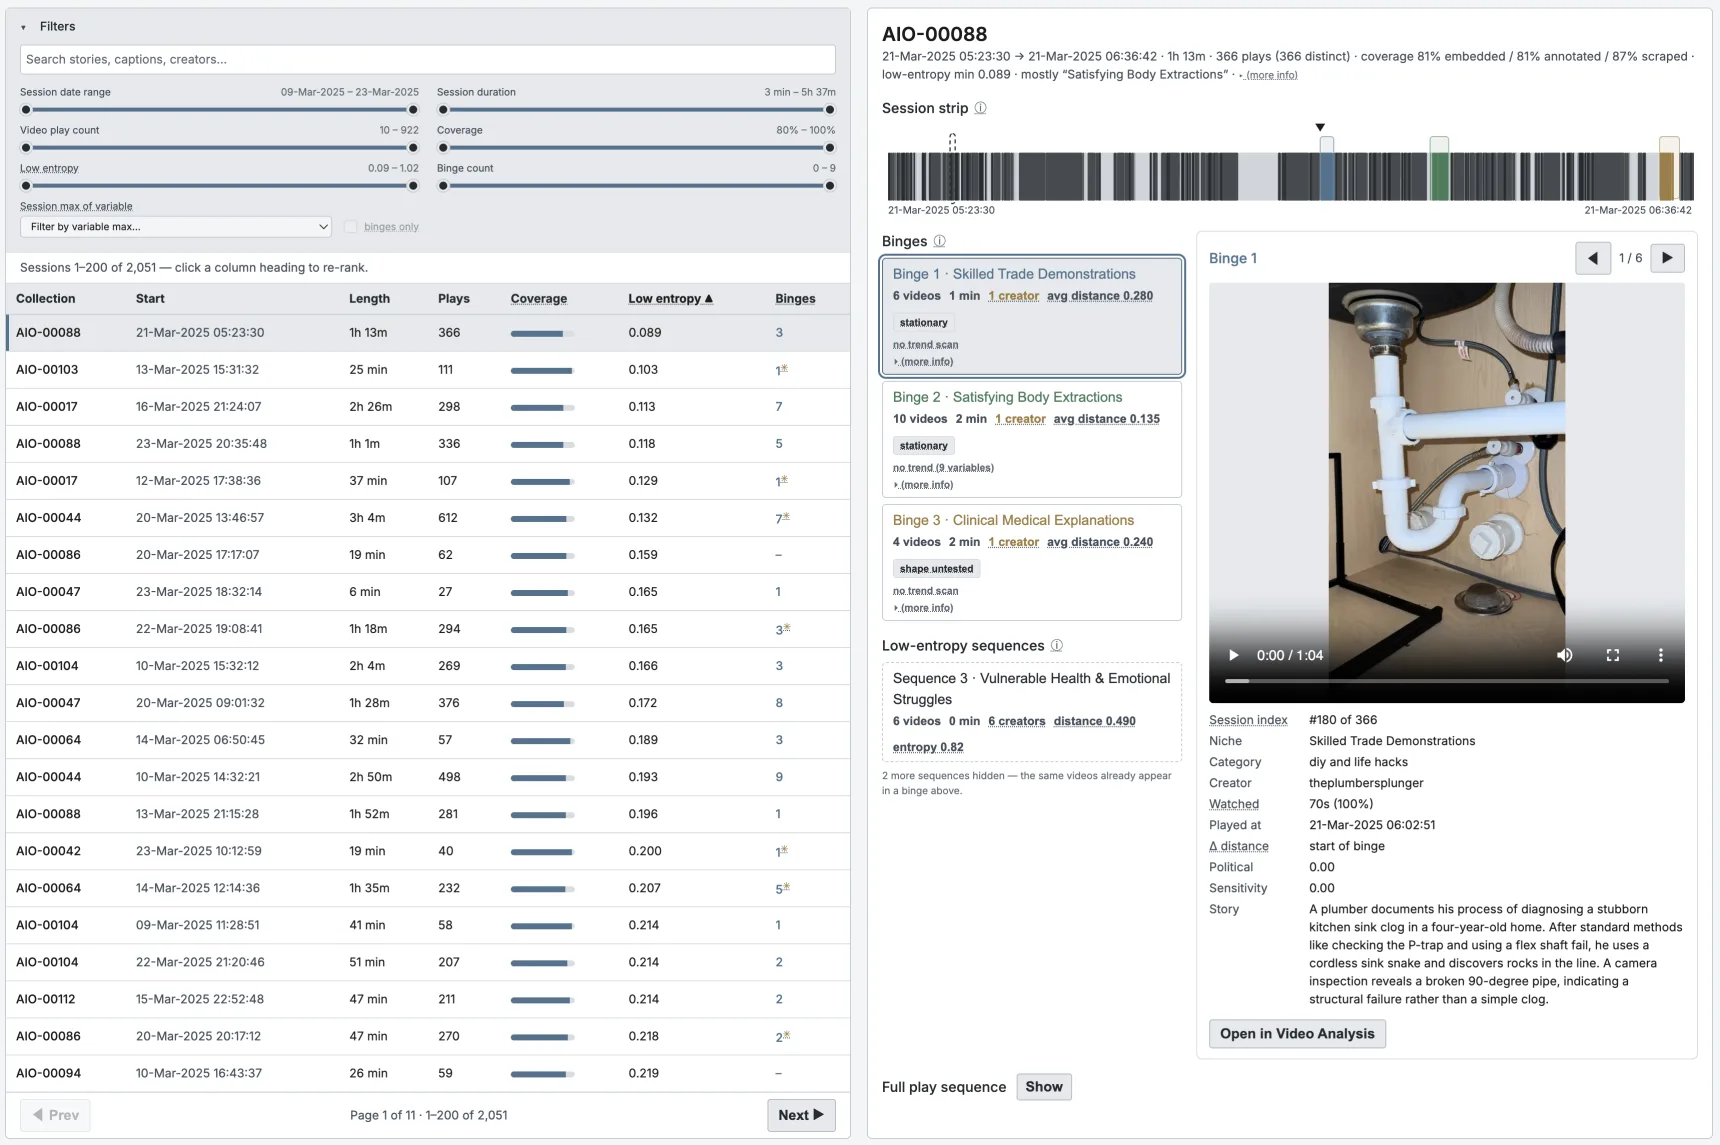
Sessions ranks individual viewing sessions, filterable by duration, plays, coverage, low-entropy stretches and binge count, and lays each one out as a session strip: detected binges, low-entropy sequences, and a video panel that opens straight into Video Analysis.
Find structure and patterns
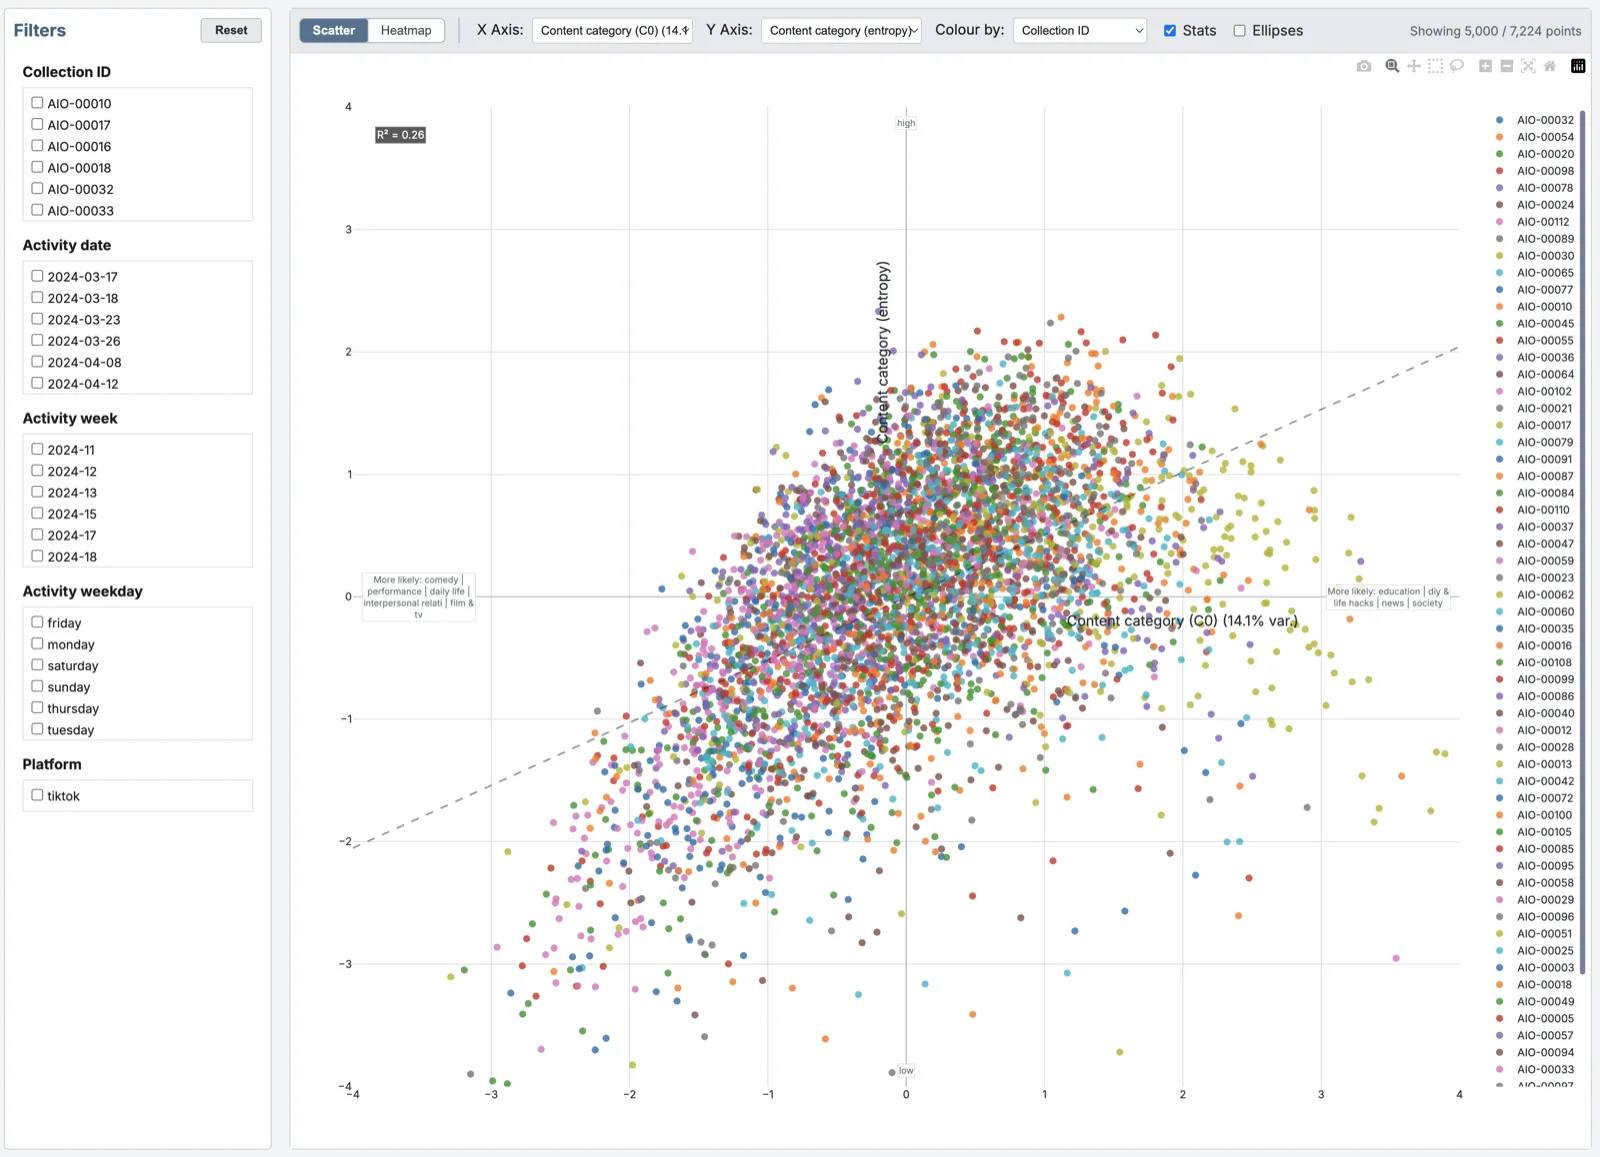
Correlations places one dot per collection-day on any two numeric axes, with group ellipses, regression lines and a full correlation heatmap, plus PCA-based measures computed per study.
Map the whole corpus
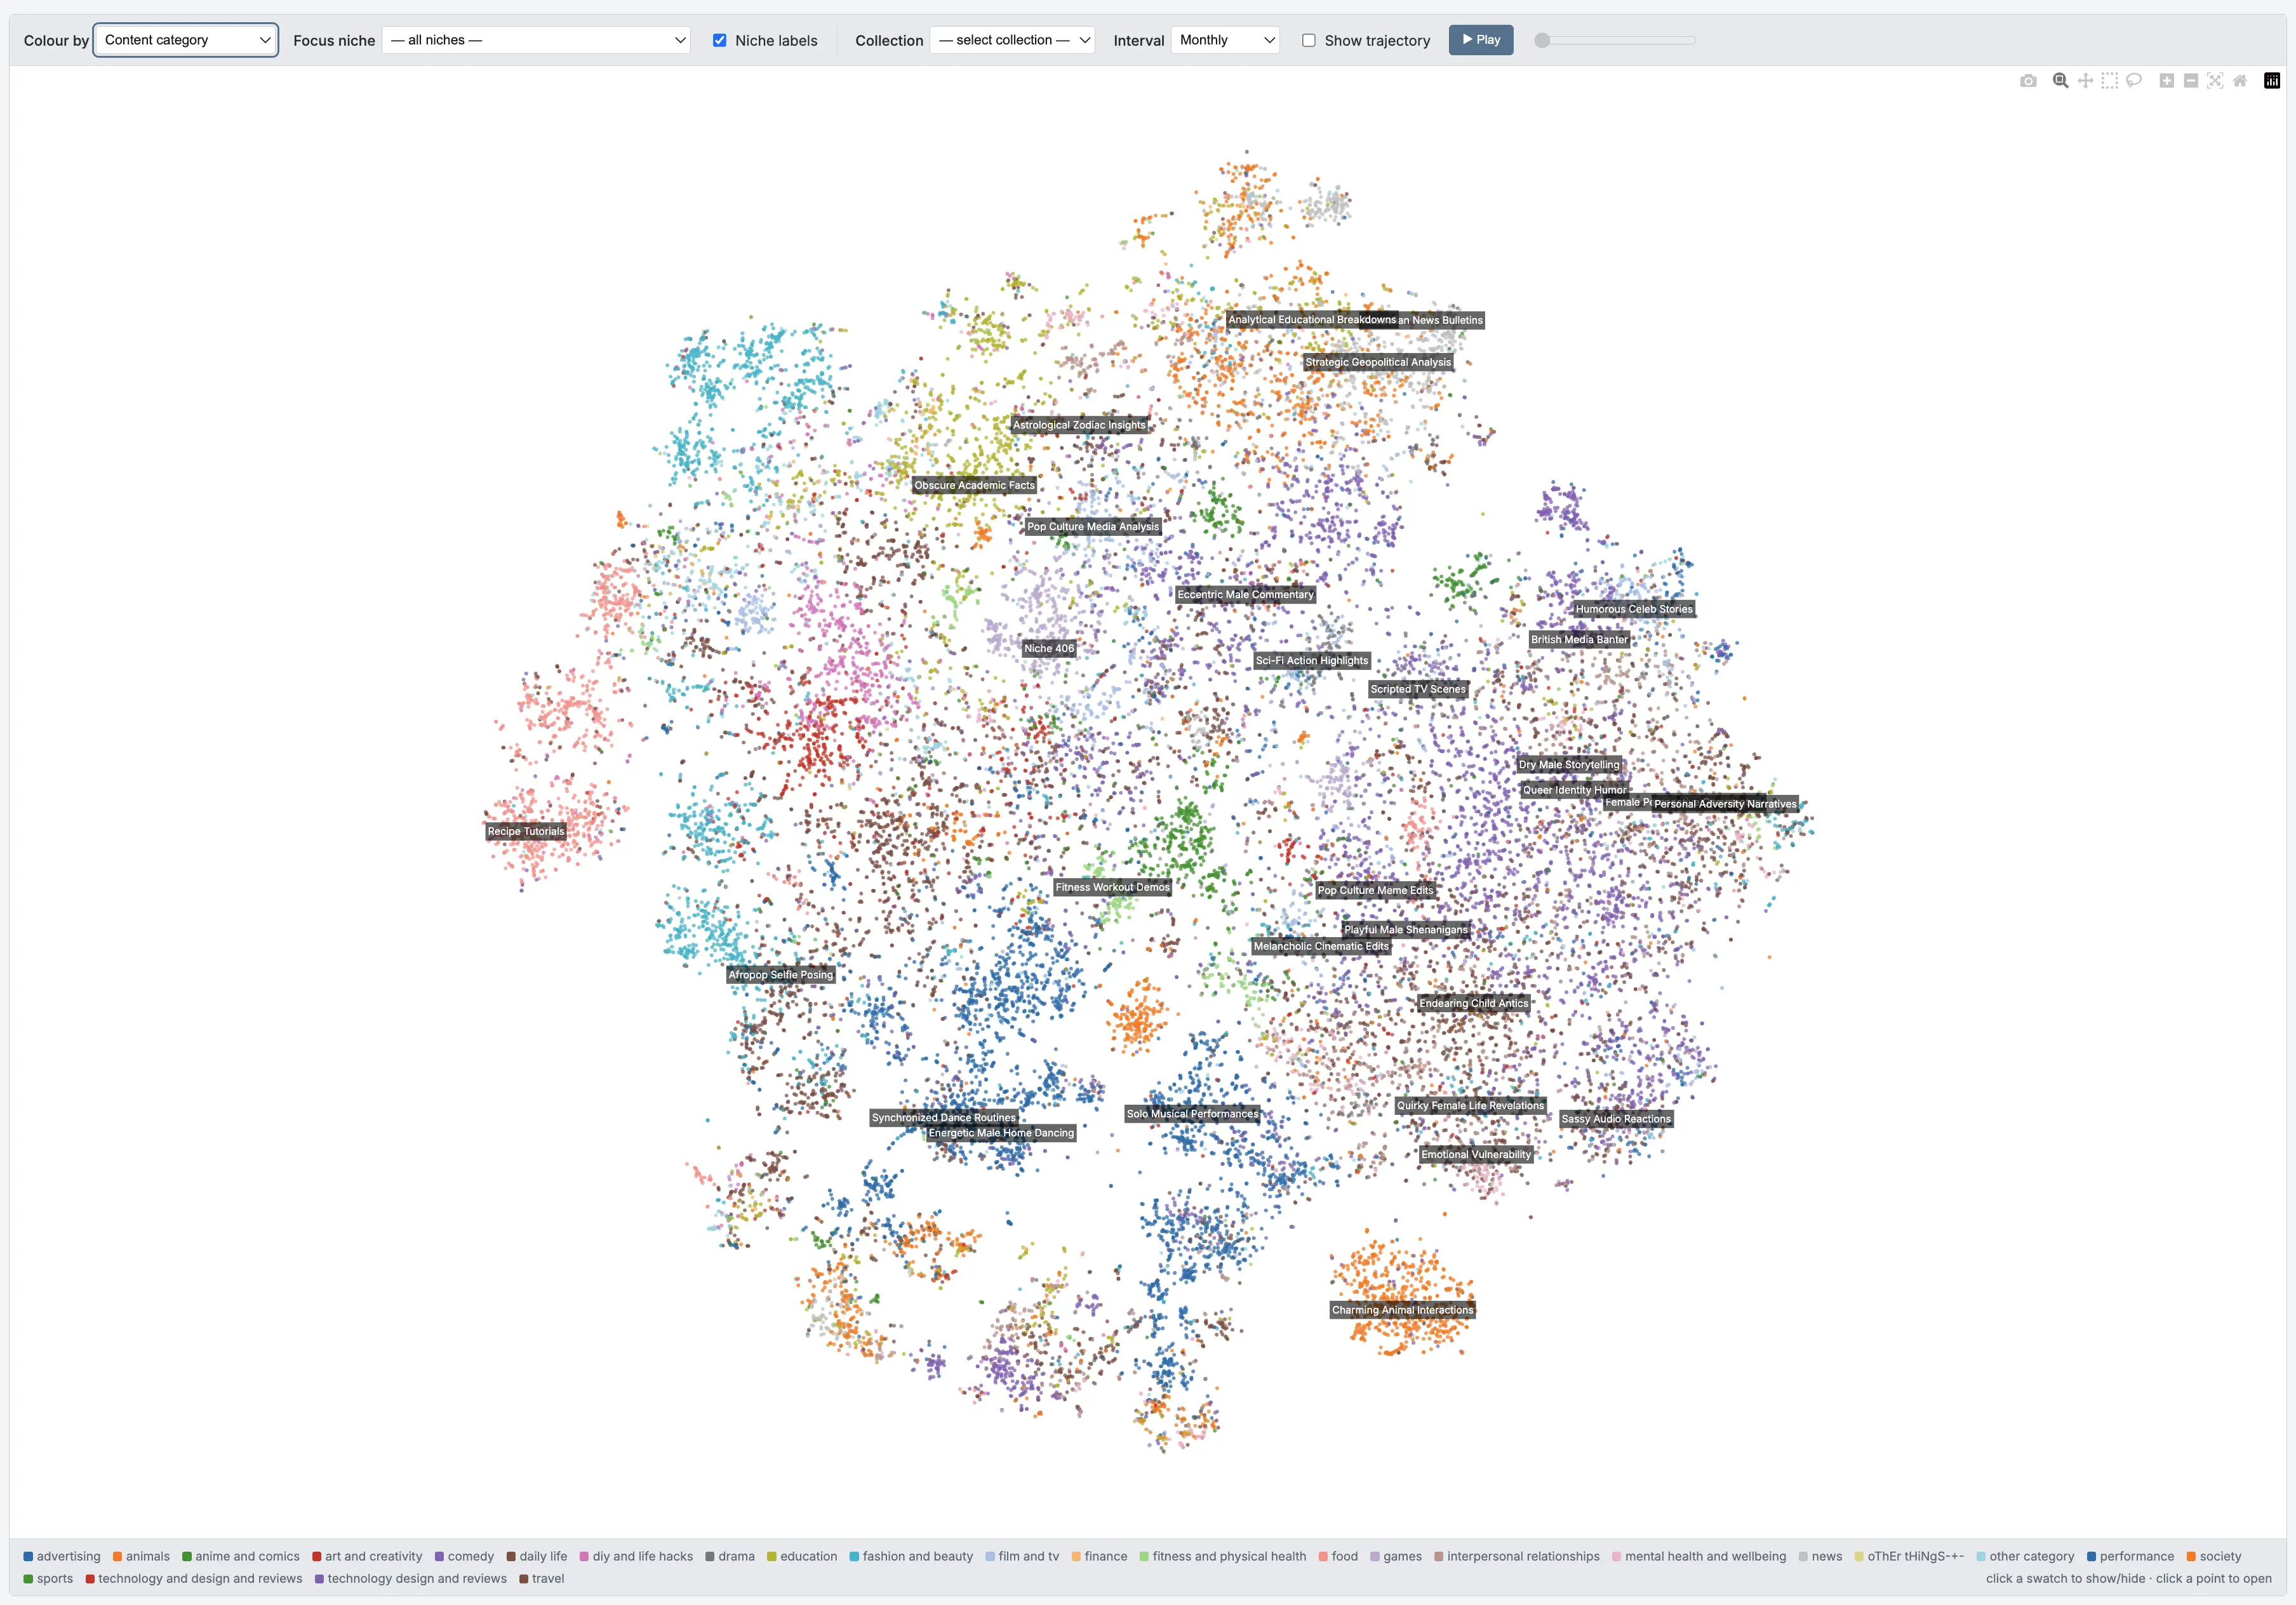
Once annotated, every video becomes a 1536-dimensional embedding built from its variables and content, then projected into a readable 2D semantic space where similar videos sit together. Semantic Space clusters that map into fine-grained, automatically named "niches" - emergent micro-genres you can focus on, label, and colour by content category or popularity. Because it spans the entire annotated corpus, the map is a bird's-eye view of what the feed is made of, independent of any single study.
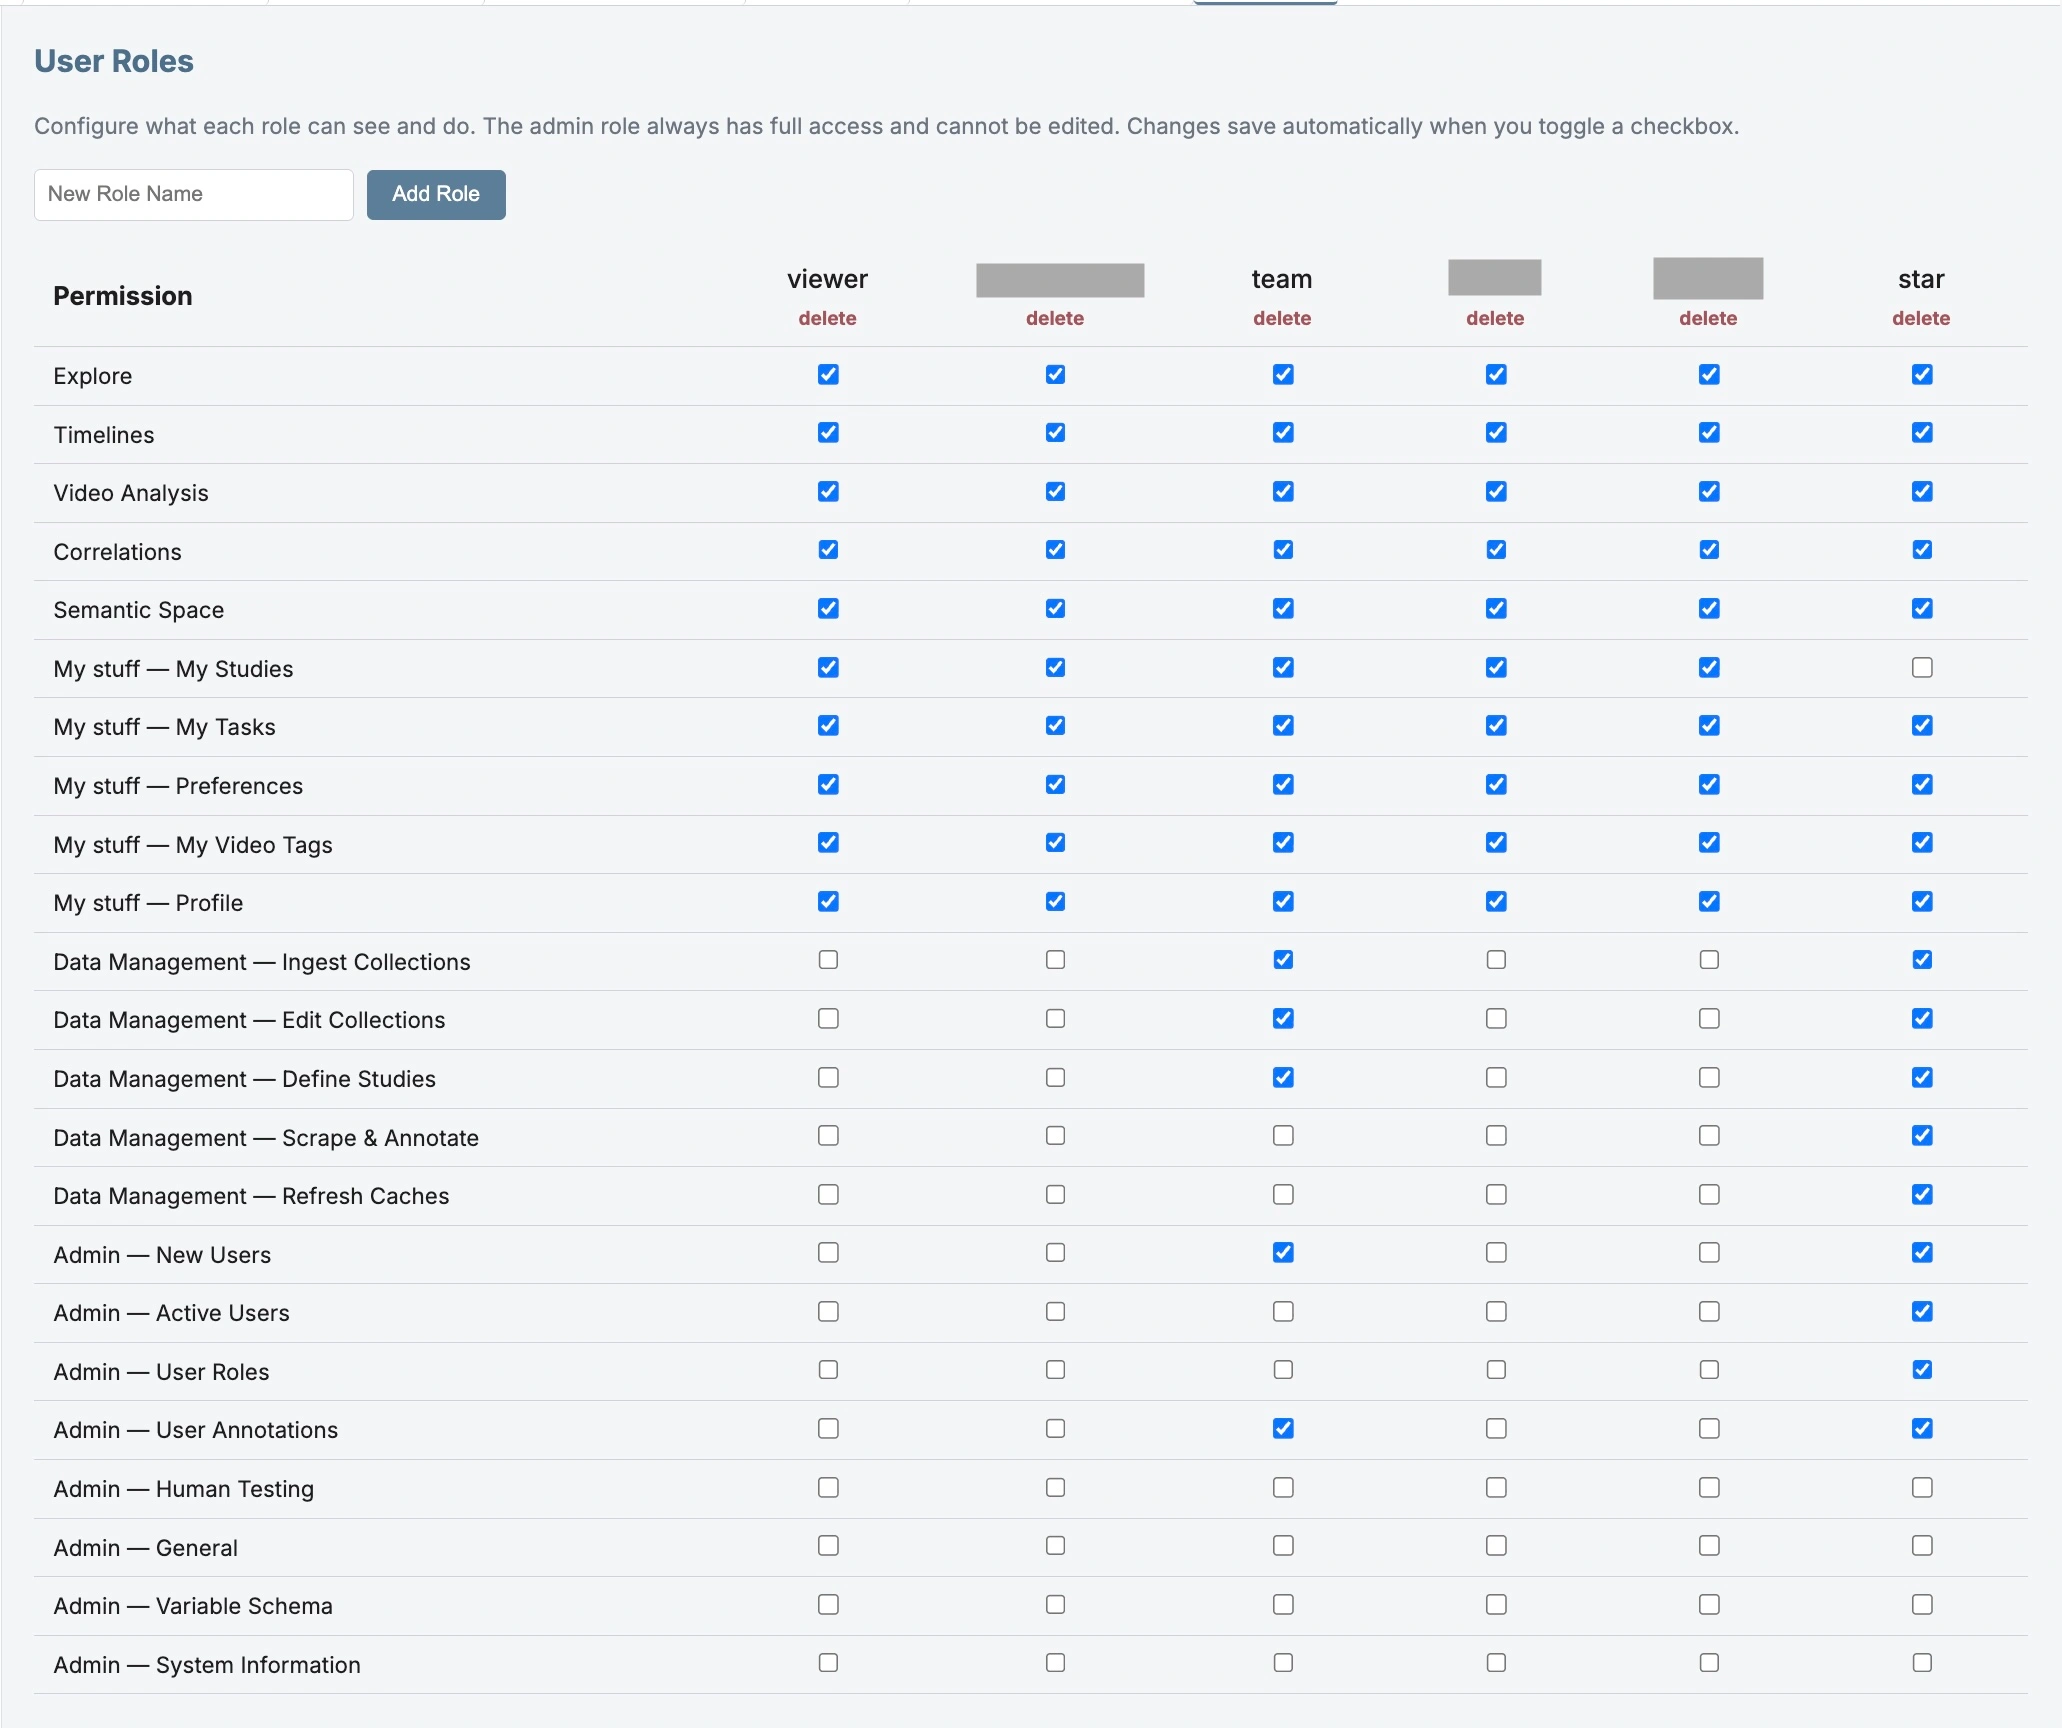
The Hub is built for teams. Fine-grained, role-based access lets you bring collaborators and students in with exactly the tabs, studies and permissions they should have, so a whole project can work from one shared corpus, safely.
How to cite the Hub
If the Hub was part of how you produced a result — you ran it, ran your own instance of it, or analysed data through it — cite it in your reference list like any other piece of research software. Copy whichever form your publisher wants:
@software{wikstrom2026foryoudatahub,
  author  = {Wikstrom, Patrik},
  title   = {The For You Data Hub: a research data toolbox for studying user experiences of algorithmically curated short-video platforms},
  year    = {2026},
  version = {0.4.1},
  doi     = {10.5281/zenodo.21994399},
  url     = {https://doi.org/10.5281/zenodo.21994399}
}
Please cite the version you actually used. Each release is archived with its own DOI at doi.org/10.5281/zenodo.21994399, which always resolves to the latest one.
Citing the software is separate from acknowledging the project: the reference goes in your reference list, the acknowledgement in your funding or acknowledgements section. If you analysed donated data held in this Hub rather than only running the software, contact info@foryouresearch.net about attribution and co-authorship before you publish.
Running it yourself
This instance is one deployment of the Hub, not the only one. The software is open source under the MIT licence, so you can run your own, which is what you want for a real study: it keeps your participants' data on infrastructure you control, under your own ethics approval.
- Get the code. Clone github.com/pwikstrom/foryou-research and follow the installation guide. A setup wizard writes your local configuration; the Hub runs on a laptop for small studies and on Google Cloud Run for larger ones.
- Bring your own keys. Enrichment and AI annotation call external services, so an instance needs its own credentials. The installation guide lists which ones and what they cost.
- Adapt it. Annotation prompts are declarative contracts you edit in the browser, and adding a platform is one ingestion class plus one scraper class. The docs folder covers architecture, configuration and the pipeline.
Feedback and bug reports
Development happens in the open, and reports from people using the Hub are the main way it improves.
- Bugs and feature requests: search the issue tracker, then open an issue with what you did, what you expected and what happened instead.
- Never in a public issue: participant data, or screenshots that identify a participant.
- Security problems: report them privately, following the security policy, not as an issue.
- Code: pull requests are welcome; start with the contributing guide.
Could the Data Hub be useful in your project?
The default dataset is just a taste of what the Hub does. If you're thinking about ingesting your own participants' data, running the full pipeline and bringing in your team, write to us at info@foryouresearch.net. We'd be glad to show you the full pipeline and talk through what working together could look like.